
Has anyone found a good way to extract data from multiple inspections of a specific template into a tabular/grid format?
I’ve tried the following, all of which are not very functional:
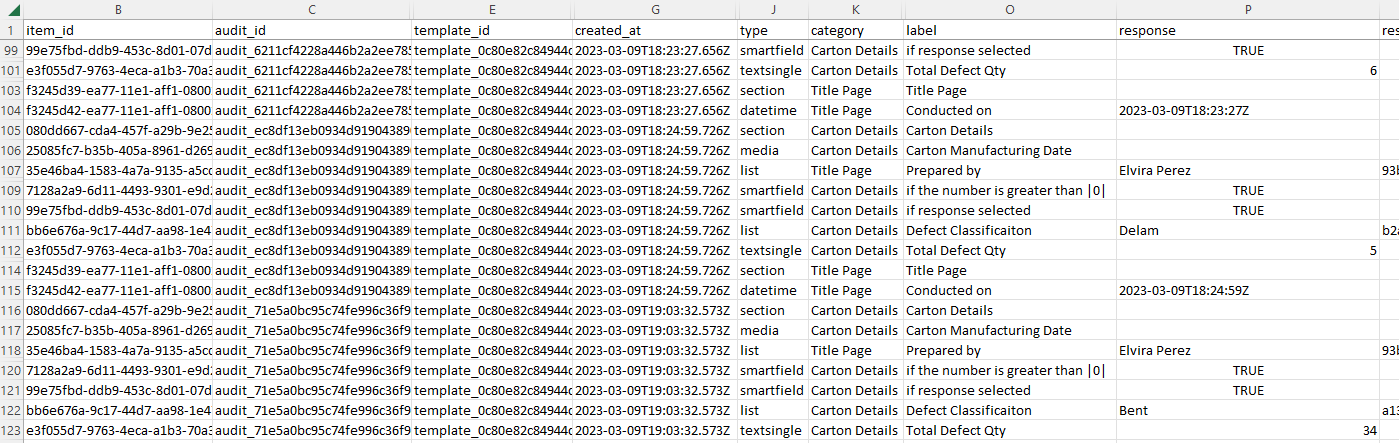
- SC Data Exporter (new version with GUI) - This extracts the “inspections” in a CSV file and “inspection_items” in a separate CSV file. However, all question labels and response values are in a single column. You cannot use a pivot table on this due to needing each question label as a filter, row or column, and the response values for those separated out by label.
- SC Analytics - The “Responses” tab allows you to see a list of inspections for a template. If click export - table as CSV, you get a spreadsheet of the inspections but without the responses. If you click “view responses” you can see charts and breakdowns of the answers for each question. However, I cannot see responses for a question based on the responses of another question - only all answers for each question regardless of how they answered the other questions.
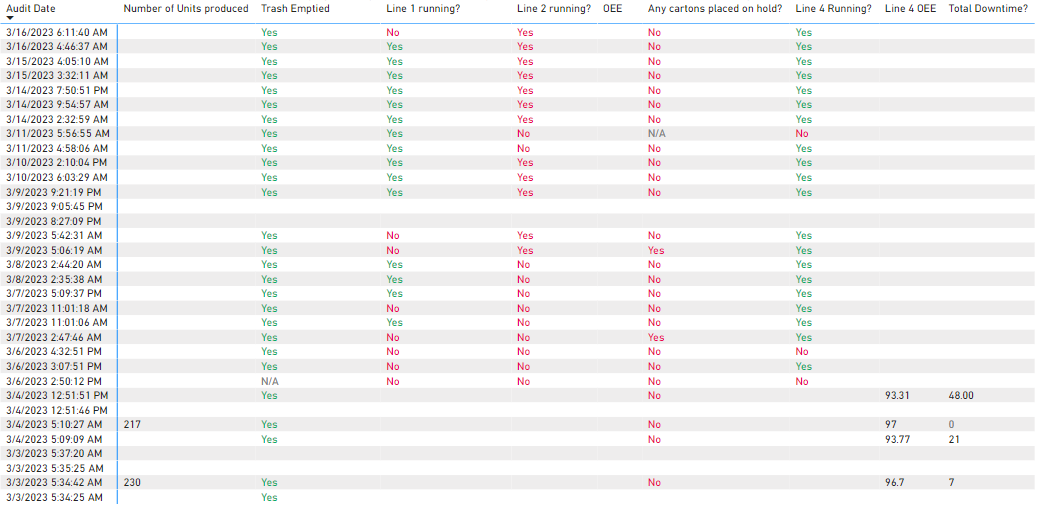
- Power BI - We have a very good Power BI dashboard, which includes a page with a line chart of numerical responses and a “matrix” visualization that shows a row for each inspection with the questions across the top. Essentially de-normalizing the data. That is EXACTLY what we want, except that when you export the visualization to a CSV file, it doesn’t output in that format; it outputs in the normalized vertical column format of the raw data tables, just like it came out of the SC Data Exporter.
See the image for an example from Power BI which is formatted properly but can’t be exported that way. I’ve also attached an image of how the exporter outputs.