Question

How to find diffrent flagged items from Analytics reports


Martti Sinnelä

Hello Friends,


Any ideas on how Analytics would show different flagged items from the used template and count the numbers of different answers?


In the template, I have various questions with different kinds of answers, and many have different answer types as Flagged items. For example

Some questions are Yes / No, and No is the flagged

Some questions are 0,1,2 where 2 is the flagged

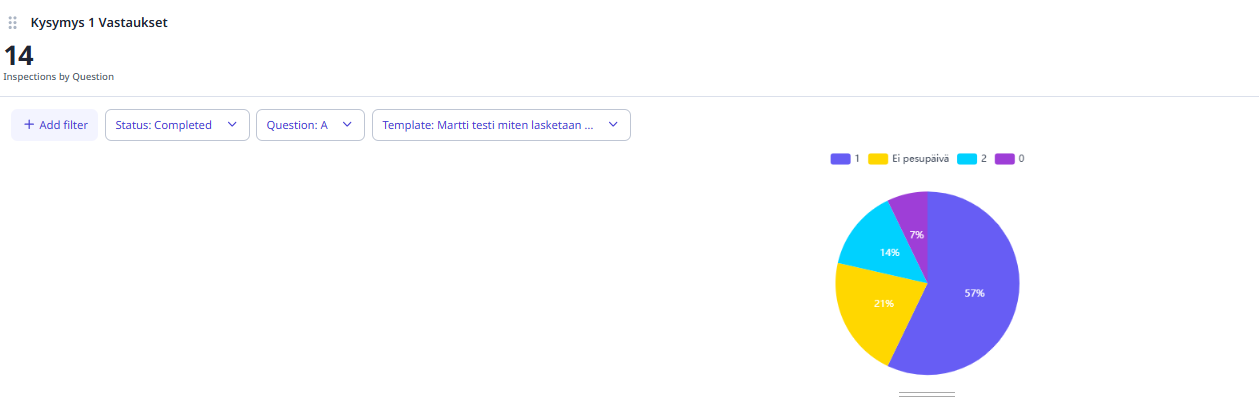
Some questions are with 4 different answers, where 2  different answers are flagged.


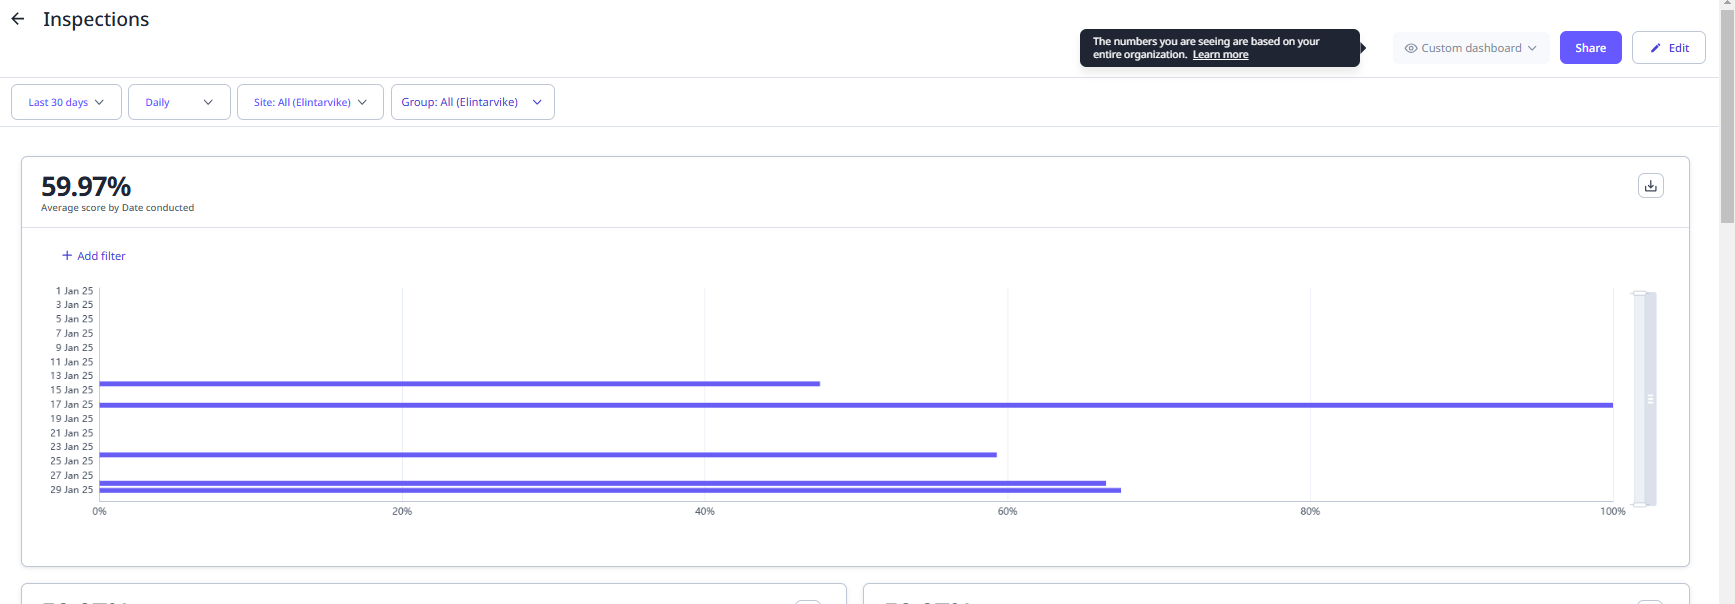
Analytics can calculate the total amount of the flagged responses and even show the reports with the most flagged items.   


But can it categorize or count only questions with yes and “no” answers?

Or can  it  categorize or count only   “1” answers 


Any tips on on this?

All ideas are welcome. 


-Martti


2 replies

thais.bendixen
SafetyCulture Crew
  • SafetyCulture Crew
  • 5 replies
  • January 29, 2025

Hi Martii,


Thank you for your feedback. Could you expand on this? Would you like to filter by specific responses, such as “1”, and only look at specific Questions? Or look at Response Sets?

Here are a few options:

  1. To look at Response Sets you can choose Responses as the Metric and Response set value as the attribute. Make sure to also filter by the specific Response set you would like to see. See screenshot below:


  1. To filter by a Response you can select the Inspections Metric and the Question attribute. You then must filter by a specific Question in a template. The resulting chart will show you the total number of Responses for that Question. If you want to hide a specific Response such as “No” you can just click on the Response in the legend of the chart to remove it. (see screenshots)


We’re currently building a Question and Response filter which will enable you to filter by Question and Response, to get more granular. You’ll be able to filter by number and text Responses. This will be coming soon.

Hope this help. 

Let me know if I didn’t understand your question. :)


Martti Sinnelä

Hello, Thais

Thank you, for your fast reply.

By watching your examples, I think, I found the answer.

It looks like ready-made analytics can not do this. 

Clicking the  59,97 %,  Gives me limited access.


However; I can  “create  dashboard”  and filter out the “status”  and questions” as I prefer:


It feels a bit too complicated, at least now, but this feels like exactly what our customers have been asking for.


Happy to see this is possible and eager to see how “Question and Response filter “  fill improve  SC even more.


Thank you.

-Martti


Reply


Cookie policy

We use cookies to enhance and personalize your experience. If you accept you agree to our full cookie policy. Learn more about our cookies.

 
Cookie settings